Sustainable Transportation
By Kevin Limanta
Transportation is a vital element of the city connecting housing, jobs, recreation, and commerce. The infrastructure to support it requires large amounts of land space. Roads themselves take up around 30% of the total land space of cities.1 Therefore, maximizing the sustainability of transportation – how transportation can produce maximum benefits to the people – in cities is essential. This can be achieved through building an accessible, affordable, economically beneficial, multi-modal and environmental friendly transportation network.2,3 Sustainability pivots on three main principles: social, economic, and environmental. Keeping these three principles in mind as we develop our transportation networks gives rise to sustainable transportation. This article will discuss three examples of sustainable transportation practices which encompass three different levels of development within the city:
- Sustainable transit
- Complete streets
- Transit-Oriented Development
Sustainable Transit
The European Union Council of Ministers of Transport defines a sustainable transportation system as one that2:
- Allows the needs of individuals, companies, and society to be safely met in a manner consistent with ecosystem health
- Is affordable, operates with equity and efficiency, provides choices, supports a competitive economy and balanced regional development
- Limits emissions and waste within the planet’s ability to absorb them, uses renewable resources at or below generation rate, minimize the impact on land/generation of noise
Approaches to sustainable transport are various and address different aspects of transportation, from choosing the mode of transportation to developing urban plans so that many people can benefit from the transportation mode provided. The Sustainable Transport Award Committee annually chooses best cities in terms of sustainable transportation. This section will review the characteristics of cities with a sustainable transport system.
| City | Metro Population (in millions) |
Transport implementations | |
|---|---|---|---|
| Yichang, China | 1.4 |
|
|
| Belo Horizonte, Brazil | 5.2 |
|
|
| Rio de Janeiro, Brazil | 11.6 |
|
|
| São Paulo, Brazil | 21 |
|
|
| Buenos Aires, Argentina | 12.7 |
|
|
| Mexico City, Mexico | 20.4 |
|
|
| Medellin, Colombia | 3.7 |
|
|
| San Francisco, United States | 4.7 |
|
|
| Guangzhou, China | 11.2 (urban) 44.3 (metro) |
|
|
| London, United Kingdom | 13.9 |
|
|
| Bogota, Colombia | 9.8 |
|
|
| Table 1. Notable examples from the Sustainable Transport Award Winners. | |||
Review of examples
Bus Rapid Transit systems have shown up multiple times as a sustainable solution to transportation. These ought to be a feasible public transport solution within a city. In addition, the success of the Metrocable in Medellin presents the possibility for cable car public transit which could be implemented in other cities with similar geographical conditions – cities with areas on hillsides which are harder to reach by road. Other notable programs include managing the traffic and conversion of streets into public green spaces and sidewalks.
Traffic management systems — such as integrated smart-parking systems, ride sharing, traffic signs and crosswalks, and congestion pricing –, are some small-scale steps that could be utilized by many cities. Green street plazas and parklets are other options that need more resources from the government, but will significantly increase quality of life of people around them. Many of the cities add and improve biking options which cover bike lanes, bike parking spots, and bike sharing programs. Shifting the public from using cars or other types of individual motor vehicles to biking and walking would promote health through physical exercise.6
Bus Rapid Transit
Mass transit is a critical component of a high-density city (see Transportation Energy Consumption on comparison between transportation solutions for low-density vs high-density cities) as it can transport more people than cars with the same amount of space. This is can be seen by the fact most cars in traffic only carry one person while consuming around 8.5 m2 of space, enough to carry 16 people in a bus. The BRT, a form of mass rapid transit, is implemented by many example cities in the previous section (all winners of the sustainable transport awards) and thus has potential as our main sustainable transit candidate.
Bus Rapid Transit systems, unlike conventional buses, can perform as the main mass transit system of a city and replace a metro system, although both can be used to provide additional transportation choices. It can achieve the same capacity in passengers per day as a light rail or metro transit.7 Cities such as Bogota, with over 2 million rides per day, and Guangzhou, with 800,000 rides per day, have testified the potential of BRTs. The 16km south east busway in Brisbane has converted 375,000 private vehicle trips to public transit. In terms of cost, however, it outperforms its mass transit counterparts having 4-20 times lower costs than a LRT (Light Rail Transit) system and 10-100 times less than a metro system.8
The benefits of a Bus Rapid Transport System are:
- High speed and reliability: BRTs can operate at speeds up to 50 km/h and like other mass transit systems, are more attractive than dealing with congestion on highways.
- Lower costs: they cost less to build and maintain than LRT and metro systems as they require less supporting infrastructure such as tracks.
- High capacity: can have comparable capacity to other mass transit systems (seven BRT carry as many passengers per kilometer as the top ten metro systems7) and significantly surpasses capacity of conventional buses. However, this does not mean that conventional buses must be fully replaced. Conventional buses can provide access to non-major routes and connect from mass transit such as the BRT.
- Operational flexibility: Can support express services in addition to regular services on the same running way.
- Flexibility in implementation: Implementation can be done is several stages and could be easily added on to, as opposed to the rail transit systems.8
There are challenges in implementation of BRT systems to obtain their benefits. Unsuccessful BRT projects in some cities accompany the success stories of BRT implementation in others. One example would be the Bangkok BRT system with only one 15km line and carries 15,000 passengers daily, less than the low-volume European BRT systems of Paris (19.1km9) and Johannesburg (60km10) which carry up to 70,000 passengers daily.11 Aside from a strong backup from political leaders, a successful BRT implementation would need to address the following challenges:
- A lack of a strong technical team working with the government, especially when handling a large ridership. A new, high-capacity BRT corridor with 15,000 passengers per hour would require a higher level of technical capabilities to plan and organize the BRT system compared to smaller-sized BRT, particularly when there are limited experiences with large BRT systems.7
- Bad perception of the BRT. The poor quality of most bus systems give the BRT an impression of a lower-class transport mode. Thorough advertisement can significantly improve the public perspective of the BRT. Especially in developing countries, advertisement can focus on air-conditioning, cleanliness, and security, which are generally absent in conventional buses.11
- Strong competition from other transportation modes. Even rail transit systems will contribute to the competition, as the media and public prefer the rail rather than buses.7 Again, this can be addressed through advertisement.
- Opposition from the existing bus operators that feel that the BRT system will reduce their revenue. Moreover, business owners along the BRT corridor also feel this way as they think that BRTs will decrease the chance of people stopping by.7
- The bias towards the need to maintain, and even increase road widths to allow for more vehicles. Converting travel lanes (lanes used by regular motor vehicles) to dedicated bus lanes is generally opposed by the notion that we would increase congestion. Rather, we should view the roads as a way to transport people, not cars, and this can be achieved efficiently with mass transit such as BRT.7
- Low modal shift (a change between modes of transport) from private vehicles. To increase modal shift to the BRT, the system should have good accessibility of buses, high service frequency and BRT priority at intersections. Decreasing fare can be an option if the shift is too low. But even if the BRT service is free, many motorcycle users and car users would not change to the BRT. We could also add private vehicle restraints such as increasing parking fees or road pricing, although an increase in fees would be opposed by private vehicle users. One solution to address this problem is by providing educational programs for the public on sustainable transport.12
Complete streets
Since the boom of the automobile and then the highway, streets have been cluttered with either speeding motor vehicles or creeping traffic jams.13 Streets have been made for cars but not the people. A complete street should have the following characteristics13,14:
- A wide enough and inviting sidewalk. Sidewalks should be level for pedestrian convenience and separated from the lanes by a curb.
- Accessible ramps to sidewalks.
- A bicycle lane on each side, either dedicated (protected and separate from the car lanes) or assigned (only marked by lane stripes and preferably colored for easy viewing)
- Bus lanes either separate or not from the travel lanes. BRT systems should have dedicated lanes such that it would not interfere with traffic or get caught in congestion and delays.
- Accessible and comfortable public transportation stops. Stops should be shaded and have clear signs to invite more people.
- Crosswalks and crossing signals to provide safe crossing for pedestrians.
- Parking spaces if parking is needed.
- Trees for shade and other greenery along the street. Additional greenery can be placed on medians in between lanes moving in opposite directions.
- Bike sharing hubs and bike parking spots.
The National Household Travel Survey (2009) shows that 50% of all trips are less than 3 miles and 28% is under one mile.13 And 60% of the trips under one mile are done by car. A 2010 survey by the Future of Transportation National Survey Many shows that 73% of Americans feel that they have no other choice than to drive. Thus, we can see that the people want to walk but they feel unsafe walking on the sidewalk due to its inadequate infrastructure, e.g. narrow, unlevel sidewalks with shallow or no curbs.
Moreover, many cyclists use sidewalks as they think streets are not safe (TOD University, n.d.). Adding a bicycle lane, preferably dedicated and separate from the travel lanes would remove the cyclists from the sidewalks, making these comfortable for pedestrians.
What impacts do complete streets have?
- Promote walking through safe and inviting sidewalks: in a study conducted on a retrofitted street in Santa Monica, California, shows that the number of pedestrians increased by 37% after the retrofit.
- Reduce air pollution: the same study found that the on-roadway ultra-fine particle (UFP) concentration decreased by 43%.15
Why do we need complete streets?
- As a physical activity, walking is important, considering that only half of US adults fulfill the physical activity guidelines16 and 66% of US adults are obese.6
- Sidewalks function as a place for public interaction. Interaction among neighbors tend to improve public safety.6
- Complete streets provides affordable transportation choices to everyone by promoting walking, cycling, and use of public transit.6
- Complete streets can relieve traffic congestion as the unavailability of sidewalks and bicycle paths encourages short-distance driving.13
Example of the benefits of complete streets
In 2010, the first major phase of the Hillsborough Street, Raleigh, NC remake had a road diet (conversion of travel lanes into wider sidewalks and dedicated bicycle lanes) in place in addition to wider sidewalks and more parking spots. In response, more than $200 million was invested in developments. Moreover, the traffic flows better than pre-remake and pedestrians are more comfortable with the adequate sidewalks.6
Challenges in implementation of complete streets
Cost is the main challenge of complete streets projects, especially when transportation funding is mostly devoted to maintaining and building roads and parking lots. Although the complete streets initiative focuses on the development of each individual street, it needs to be part of a larger city-scale investment to be effective. For example, adding bicycle lanes on a single street would not have a significant impact on the city. The program must be integrated to a city-wide bicycle lane network with parking and bike-sharing facilities.6
Boston complete streets plan diagrams
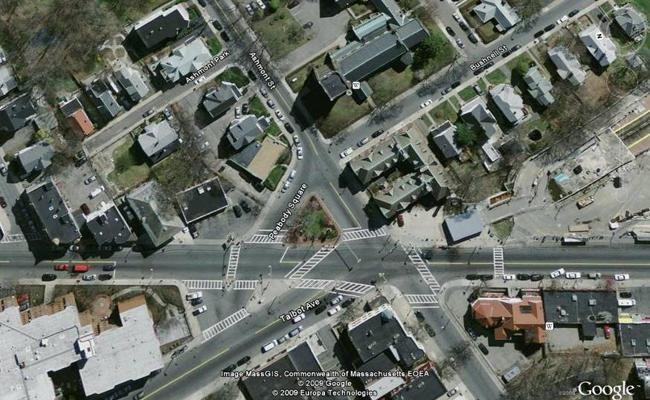
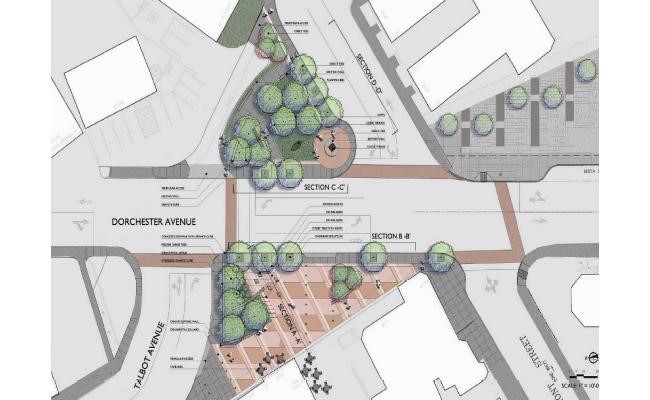
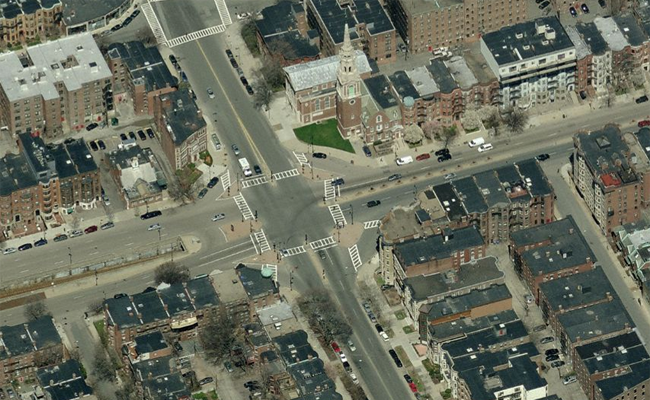
The Boston Complete Streets initiative aims to transform the streets of Boston into convenient public spaces which are part of a sustainable transport network. Their website http://bostoncompletestreets.org/ contains more in-depth explanations of a complete street’s components as well as documentation of ongoing complete street projects in Boston. Some example pictures from the Boston Complete Streets program are provided below. Figure 1a shows an aerial view of the current Peabody square in Dorchester while Figure 1b and 1c show the design plan and current Google Earth aerial map of the square. Figure 2b and 2c show the current and planned design of Audubon Circle, Fenway.
 |
 |
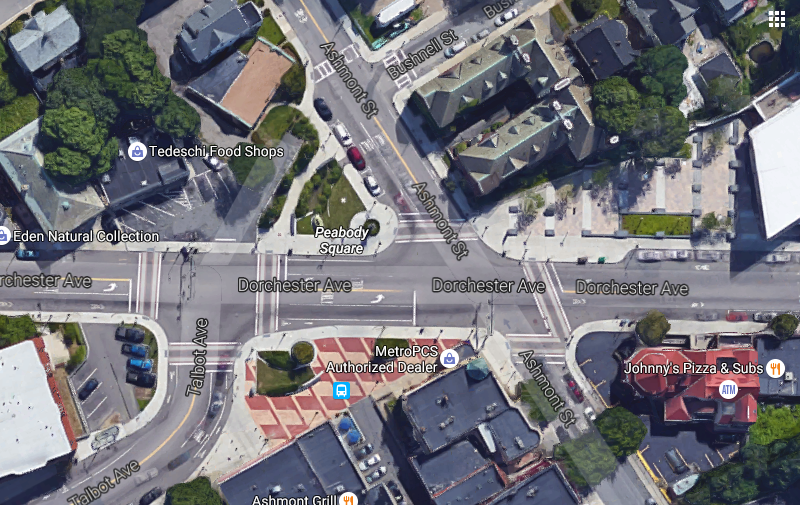 |
| Figure 1a. Peabody square, Dorchester. Before.17 | Figure 1b. Design plan. The design plan converts excess streets into green plazas and parklets seen from the conversion of the middle bottom street into a plaza which can have benches and tables. The Peabody square corner (in the middle of the diagram) which is converted into a parklet. | Figure 1c. Current aerial view of Peabody square. Taken from Google Earth.18 |
 |
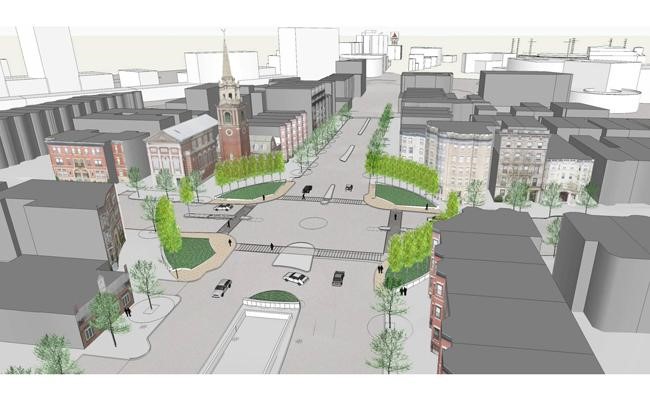 |
| Figure 2a. Audubon Circle (before).19 | Figure 2b. Design plan.19 Excessive strips of road at intersections can be converted to green spaces adding color to the city. The intersection is changed into a traffic circle which slows down incoming traffic and thus, reduces traffic accidents.13 |
Transit Oriented Development
Providing public transport is one thing but maximizing the potentials of the public transport is another. Transit Oriented Development describes how public transport can shape urban communities to take full advantage of the transit opportunities.
TOD can be summarized as the development of an area, about a mile in diameter, around main transportation nodes (usually rail stations) into a high-density, mixed-use, walkable community. Figure 3 shows the TODs in Arlington, Vriginia. The area should provide shopping, housing and employment opportunities within walking distance.20 Public transit should provide access to other parts of the city.
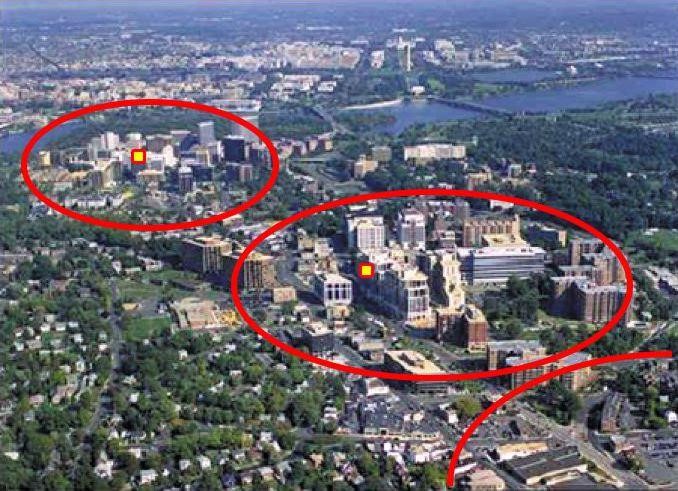
Figure 3: Rosslyn-Ballston corridor in Arlington, Virginia. High-rise buildings in the red circles show the high-density districts which constitutes the TODs. These TODs surrounds the bus corridor. Source: Wikimedia Commons.
The TOD first needs to be close to a major transit node. In addition, the Transit Oriented Development Institute states 10 criteria for a TOD21:
- Well defined public spaces – outdoor rooms: Buildings should provide enclosure around public spaces and the public spaces should incorporate human-scale features such as green spaces, fountains and benches.
- Mixed-use blocks: Every block should incorporate multiple uses by mixing retail, residential, commercial and offices.
- Quality pedestrian experience: A comfortable and safe pedestrian access to the station.
- Human-scale architecture: Applying attractive architecture on buildings
- Tree lined streets: To create shade.
- Active ground-floor retail: A continuous line of active shops on main streets, preferably stores with narrow storefronts to provide color, plus adequate sidewalks especially for outdoor dining cafés.
- Cyclist accessible: Providing bike sharing stations, bike racks and bicycle paths
- Reduced and hidden parking: Reduction in total parking spaces and using clustered parking to encourage walking
- Affordability: A variety of housing options and affordable grocery and retail stores.
- Expandability: How a project could influence the surrounding areas to change.
A successful TOD would provide living space within range of public transport. These districts would positively impact the sustainability of the city by maximizing the population density near the public transport node, reducing the number of nodes thus reducing the building cost while serving as many people as possible. By encouraging walking, TODs reduce car usage and thus traffic in the city. Some examples of cities with TODs include Curitiba, Brazil, which has high density buildings around its BRT system (Fig. 4), and Hong Kong, where currently 90% of all trips are by public transport due to the proximity of population-dense buildings to the metro nodes.22

Figure 4: A successful TOD along BRT corridor in Curitiba, Brazil due to strong zoning laws.22 High rise buildings are part of the high-density characteristic of TODs.
Why TODs are desirable for cities?
A case study on TODs in Washington, D.C. and Baltimore show that 20% and 23% households from Washington, D.C and Baltimore respectively have no cars. This can be compared to the 5% and 9% zero-car households in non-TOD areas. This is due to lower needs of cars in presence of highly accessible transit, and the low parking space availability.20
The TODs promote walking, biking, and transit use which are healthy for the city. In the same case study on Washington, D.C TODs, 35% of trips are covered by walking, biking or transit. This is three times the 13% of the non-TOD areas. In the TODs, 45% trips to and from work are by walk, bike or transit: the number of trips are almost on par with the number of trips by car. It also reduced the average trips by car, from the non-TOD average of 83% to 62% in TODs.20
Although living in a seems to be more expensive due to the proximity to transit, on average, TOD residents in D.C. and Baltimore have lower annual income. This shows that TODs are more affordable and are not exclusive to the higher income households. TOD housing is currently aimed at smaller households which mainly includes singles and couples with a single child or none. This can be seen from the lower average household size in TODs. Washington, D.C. TODs have an average household size of 1.81 which is lower than the non-TOD average of 2.29. Similarly, the TOD households in Baltimore have an average size of 1.74 which is also lower than the non-TOD average of 2.20. This hints that, due to the specific market, housing prices in TODs will not be significantly different to prices in non-TOD areas.20
Lower block sizes encourage walking on short distances as it is more convenient for pedestrians. This will reduce congestion in these areas as a significant portion of traffic in cities are (28% of trips) are less than a mile.13
TODs work the best for cities with extensive public transport. Baltimore, although having an extensive bus system, only supports a light rail line and a commuter line which extends to Washington, D.C. This affects the size of the impact of a TOD on the preferred mode of transport. TODs in Baltimore promote walking, biking, and transit just by slightly and reduce the number of trips by car from 79% in non-TODs to 74% in TODs.
Final Overview
BRT is a cheaper alternative to metro or light rail transit system and has comparable capacity to the two. BRT is a viable choice for a city’s sustainable mass transit system. Furthermore, a complete streets program can create a pedestrian-friendly street environment which will support existing public transport and the BRT system. Transit Oriented Developments takes full advantage of the present public transportation networks and densifies areas around mass transit nodes. This gives more people access within walking distance to mass transit. These three solutions can increase sustainability of transportation in cities.
